The Science behind the Lockdown

Our ‘lockdown’ is now total across our nation and much of the world. Why would governments go to these extremes? As the shelter in place ordinance is now impacting all of us, I thought it important to look into the science behind lockdown in a little more detail.
Pandemic modeling is now driving public policy. The Imperial College Model is predicting millions of deaths from the coronavirus. Similar models in the United States show similar alarming trends – without severe sheltering in place, we can expect hundreds of thousands, if not millions, of deaths in this country.
I don’t have access to the modern models. These modern models no doubt include network and risk elements. But we don’t need the complications – a century old compartmental model works just as well to get a feel for what is going on.
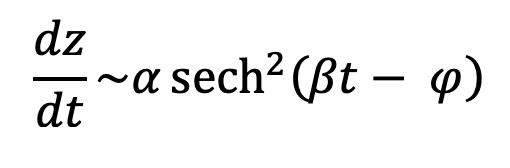
At the beginning of the last century, attention turned to mathematical models of plague, and later pandemic flu. They began by partitioning people into one of three groups: those who had the infection, those who were susceptible to the infection, and those who were removed through recovery or death. Assuming a constant infection rate, the compartmental allows us to estimate the number of infections per unit time:
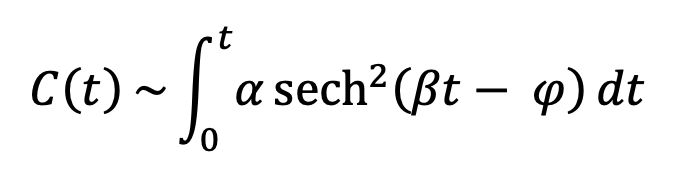
The total number of infections is simply the integral of the above
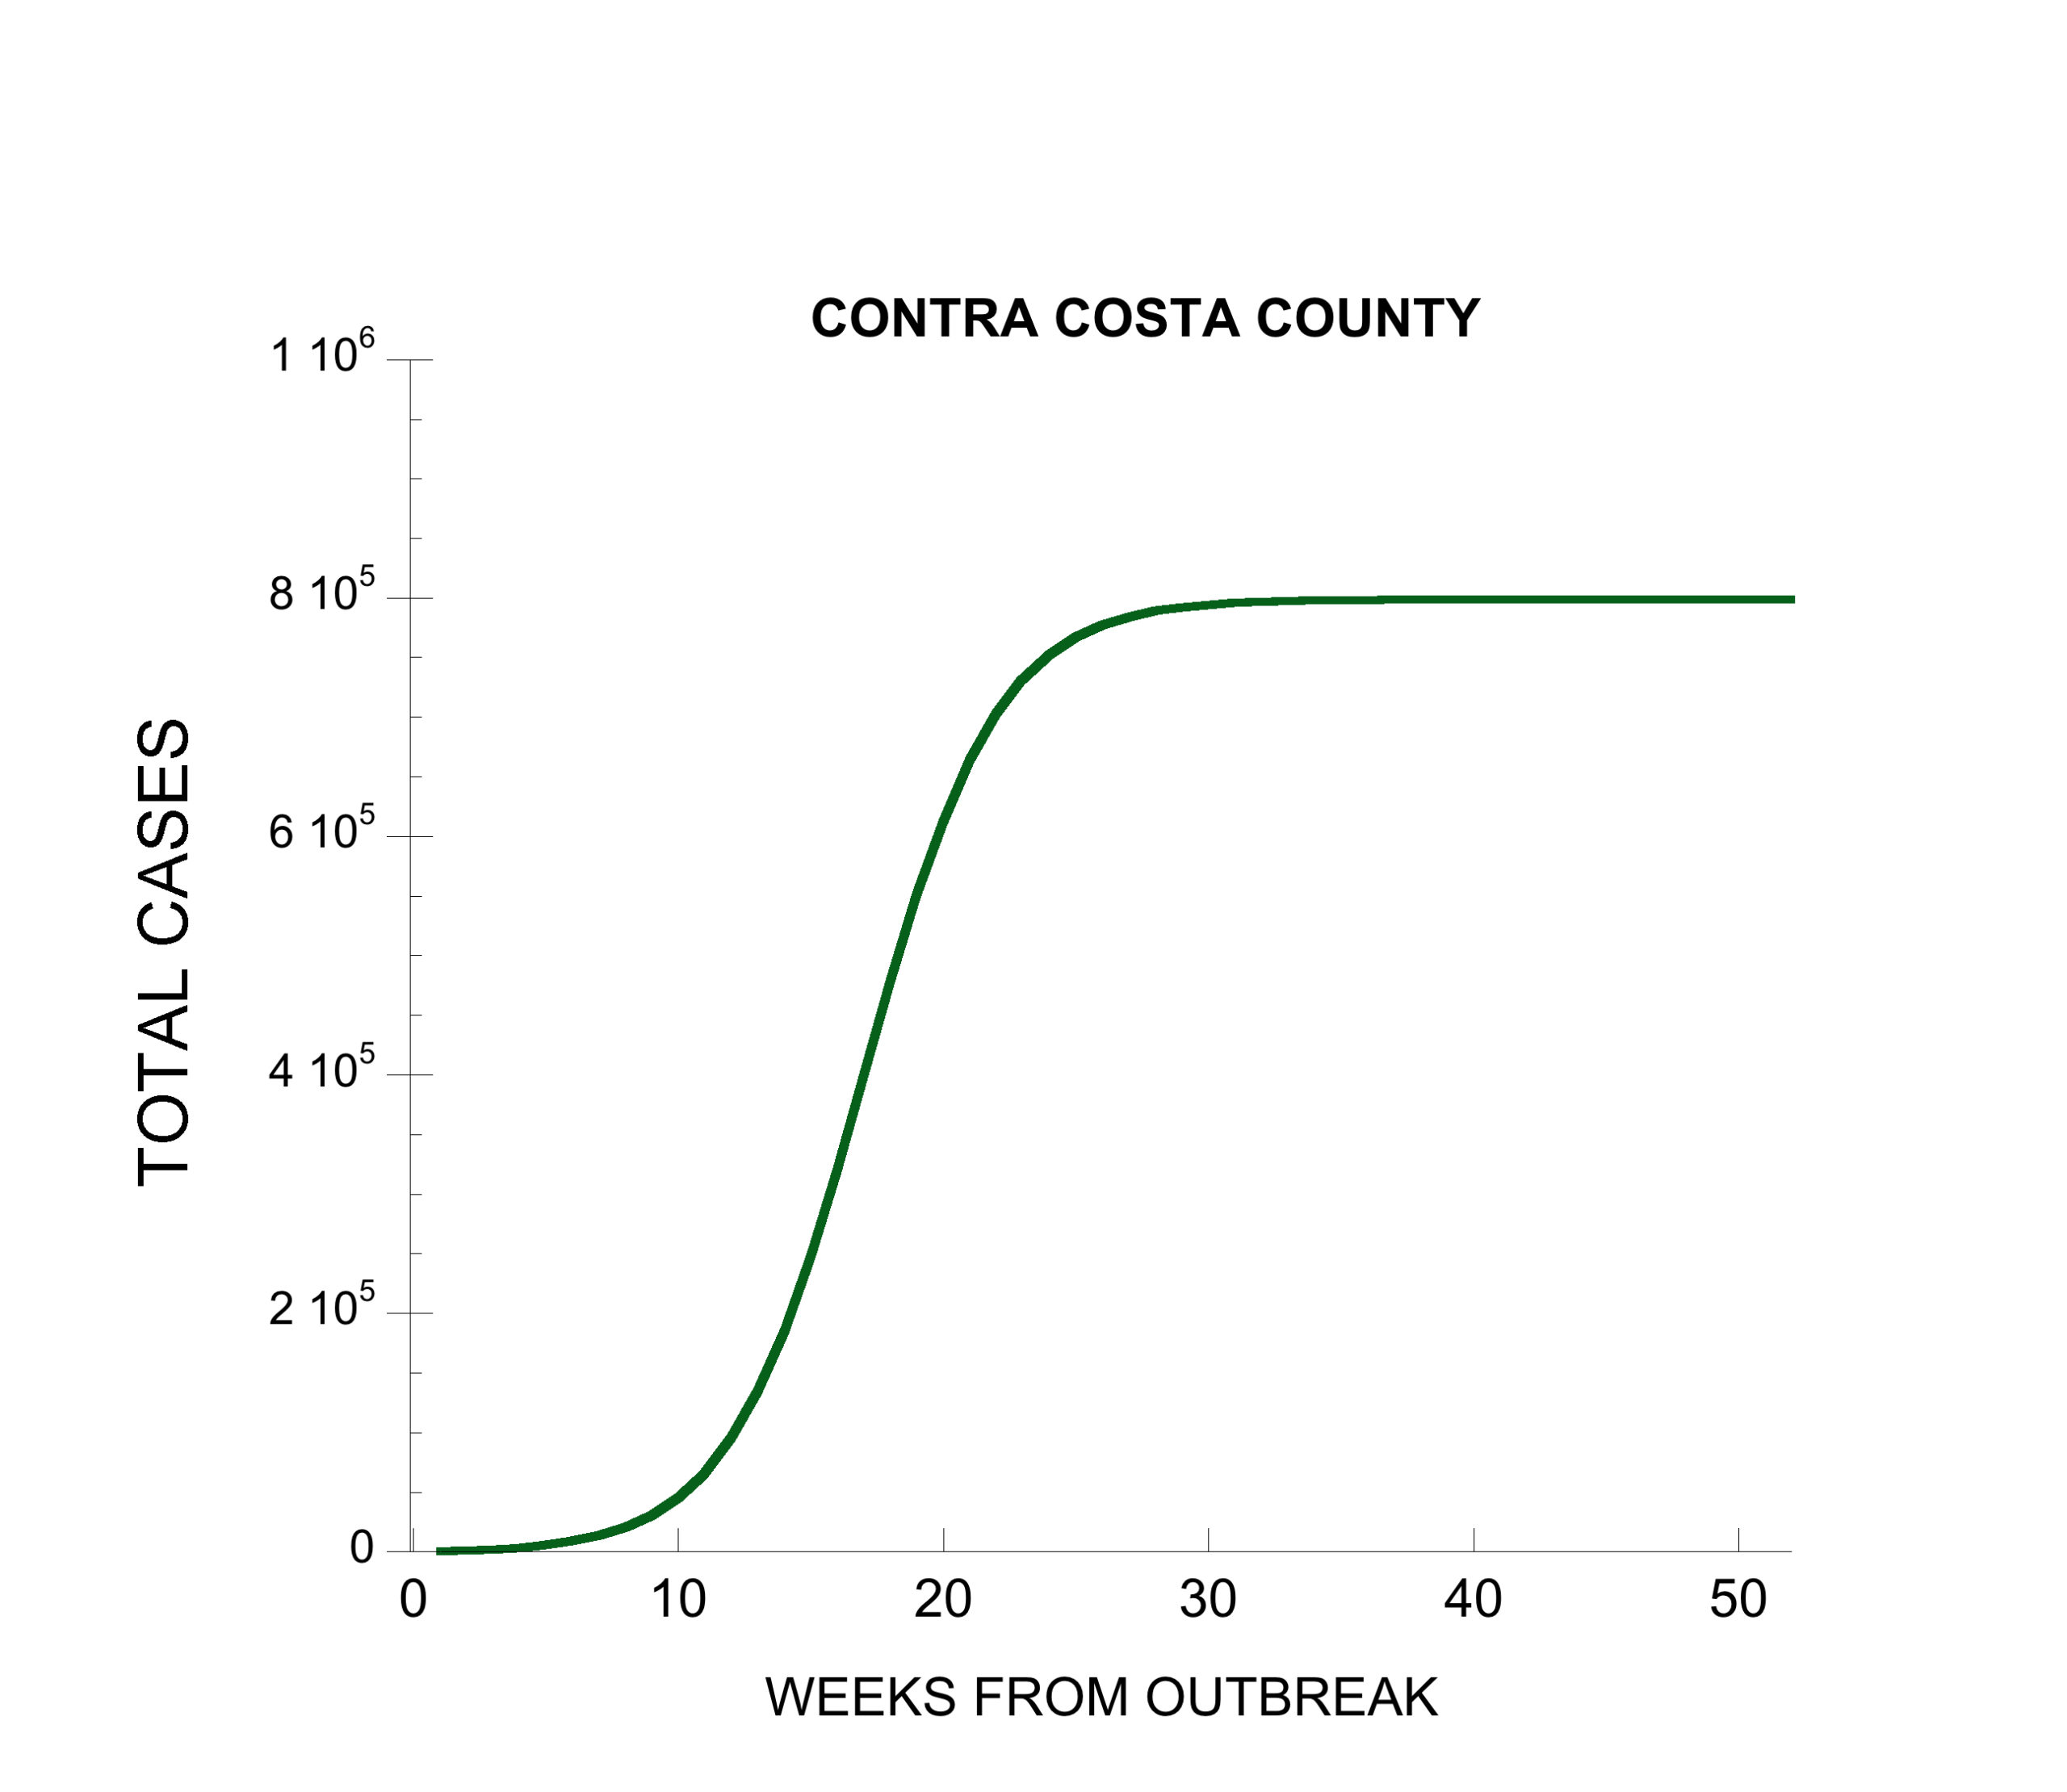
I assume that most of the modeling results that have been headlined in the news use the worst-case scenario. For Contra Costa County (where my mother in law is held captive in an assisted living facility) we can estimate a scenario where a single individual can infect 3 people and an incubation of 1 week. This predicts the infection rate will peak some time in June, and that 80,000 residents of the county will become infected in a single week (see the chart). The infections will run their course in about 30 weeks with a total of about 800,000 people infected.
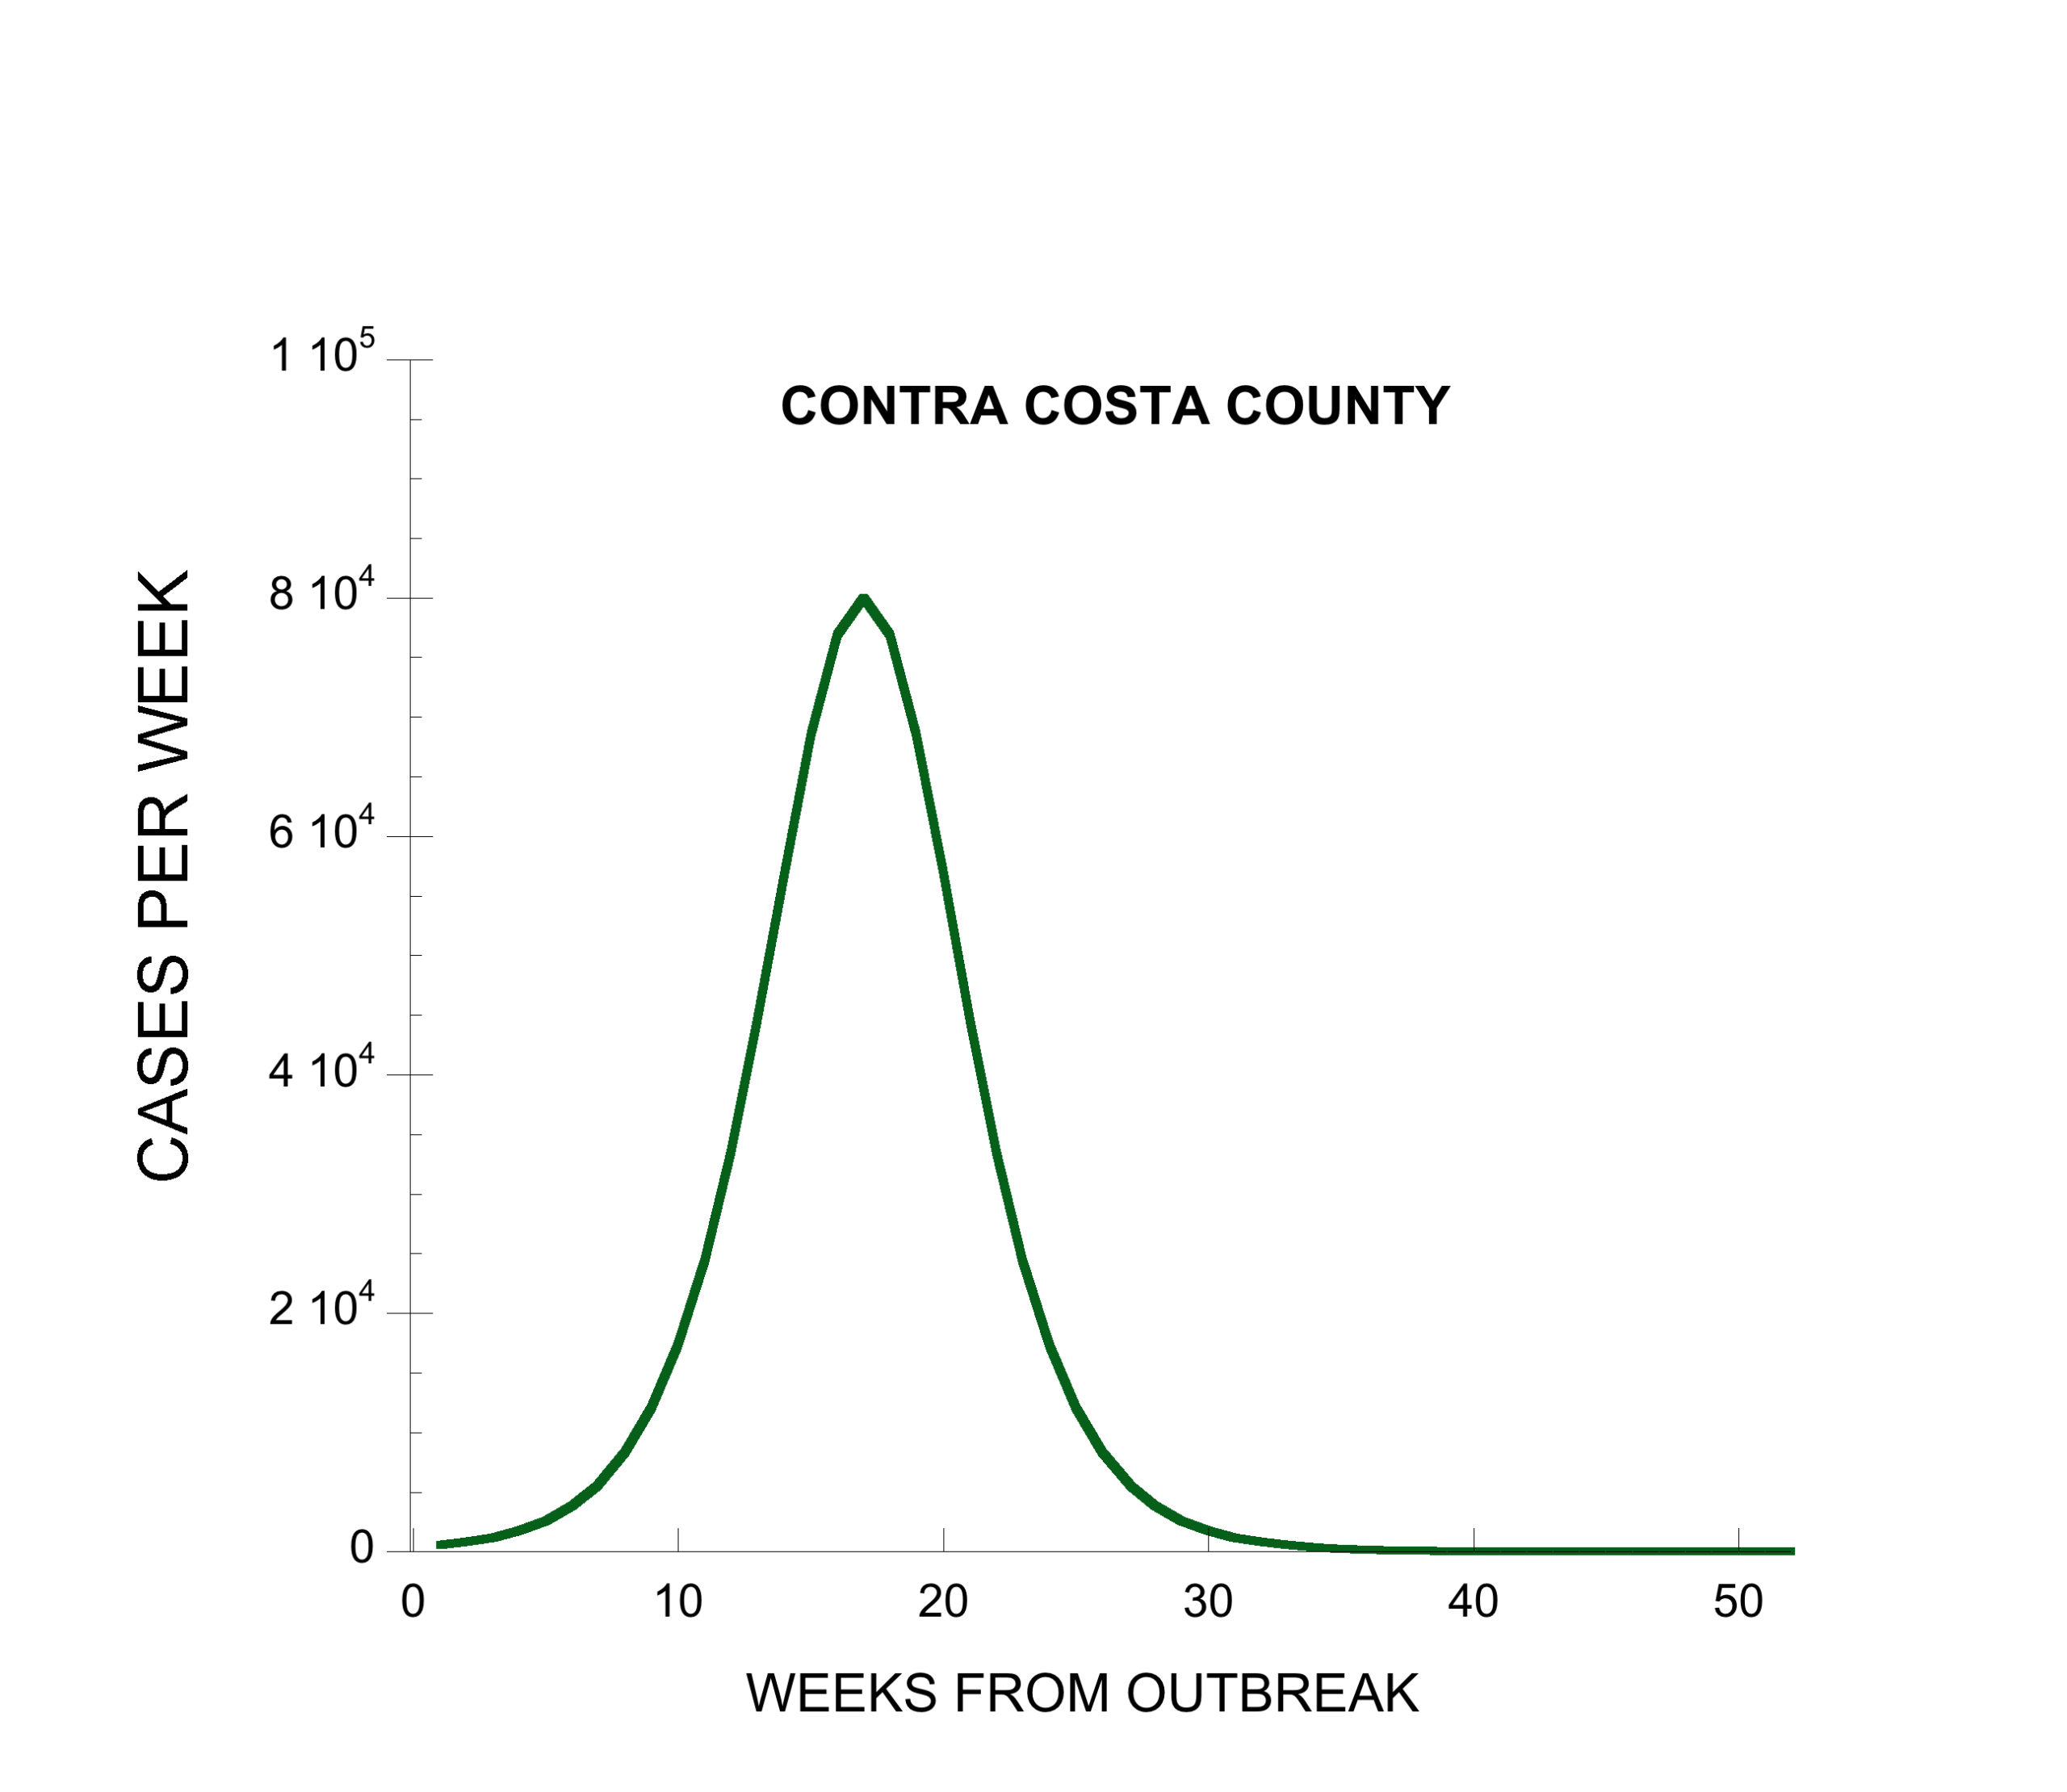
I should note that the professional modelers are predicting the peak in infection rates will occur much earlier – in April rather than in June. Nevertheless, these numbers are staggering. If our hospitals are overwhelmed, we could see death rates of 10%, which means as many as 80,000 residents in Contra Costa County could die from coronavirus before it runs its course.
This is alarming and scary, as all worst-case scenarios are. This is what is driving public policy. And, perhaps, it is a good thing to keep us shutdown for now until we learn more about this disease.
Winemakers are optimists. I like to look at a best-case scenario, where we shelter in place until social distancing and cleaning standards can be developed to allow us to return to work. Here, I assumed that the number of infections will be too small to worry about, so I got rid of the recovered group. Now, I have a two partition model – those who have it and those who are about to get it. Then, I fit the simplified expressions to the first week of post-quarantine data from the county (to March 24). This is the result-

These predictions are massively different – the errors caused by uncertainties in the true infection rate, incubation time, and how the virus is transmitted. However – both models will lead to the same number of cases – the optimistic model just spreads it out in time. This will help to lower the death rate and give us time to develop treatments and vaccines. Just be glad you don’t have to create the public policy for this disease.
In June, I will take a look back and see how the models are working. Let’s hope that the best case scenario works out.